What Did Mahindra & Mahindra Report in Q3 FY26?
When a big car company makes more than 30% more money, the markets pay attention. But what's more important is why that growth happened and if it will last.
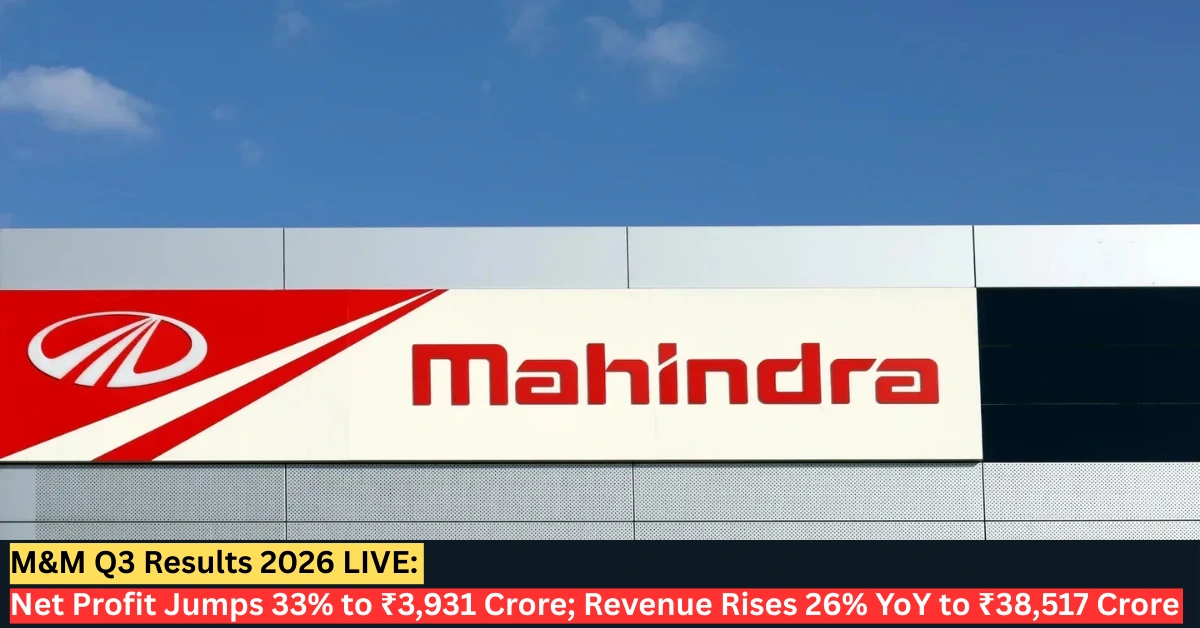
Auto major Mahindra & Mahindra (M&M) announced strong Q3 FY26 earnings on 11 February 2026, reporting a 32.6% year-on-year increase in standalone net profit to ₹3,931.30 crore, compared to ₹2,964.31 crore in the same quarter last year.
Revenue from operations grew 26.12% YoY to ₹38,516.8 crore, up from ₹30,538.2 crore. The growth was driven by strong performance across both automotive and farm equipment segments, reflecting diversified demand strength.
At the operational level, EBITDA rose 27% YoY to ₹5,668 crore, while EBITDA margin improved slightly to 14.7% from 14.6%, signalling operational stability despite cost pressures in the sector.
The key takeaway is not just revenue growth — it is the expansion in earnings efficiency.
Why Did Net Profit Rise 33% Year-on-Year?
Volume growth and operating leverage were the main reasons for the strong growth in earnings. The total number of sales in the December quarter rose 23.1% from the same time last year to 4,22,937 units. This shows that demand is stable and prices are healthy.
Automotive segment revenue rose 26.55% YoY to ₹28,361.48 crore, while segment EBIT increased 23.85% YoY to ₹2,683.94 crore. SUV revenue market share improved to 24.1%, up 90 basis points, reflecting competitive strength in the premium utility vehicle category.
The farm equipment part also did well. Revenue went up 24.88% to ₹10,199.69 crore, and EBIT went up 39.36% YoY to ₹2,060.78 crore because of better margins and high demand for tractors.
How Did the Auto and Tractor Segments Perform?
The automotive business recorded 23% YoY growth in total auto sales to 3,02,238 units, compared to 2,45,499 units last year. Premium SUVs and strong market positioning supported the revenue expansion.
The tractor business posted 23% YoY growth in total tractor sales to 1,49,567 units, up from 1,21,774 units. Although tractor market share in Q3 stood at 44.0%, the company maintained leadership in the segment.
Below is a consolidated financial comparison:
M&M Q3 FY26 vs Q3 FY25 Performance
| Metric | Q3 FY26 | Q3 FY25 | YoY Growth |
| Net Profit | ₹3,931 Cr | ₹2,964 Cr | 32.6% |
| Revenue | ₹38,517 Cr | ₹30,538 Cr | 26.1% |
| EBITDA | ₹5,668 Cr | ₹4,468 Cr | 27% |
| EBITDA Margin | 14.7% | 14.6% | +10 bps |
| Auto Sales | 3,02,238 units | 2,45,499 units | 23% |
| Tractor Sales | 1,49,567 units | 1,21,774 units | 23% |