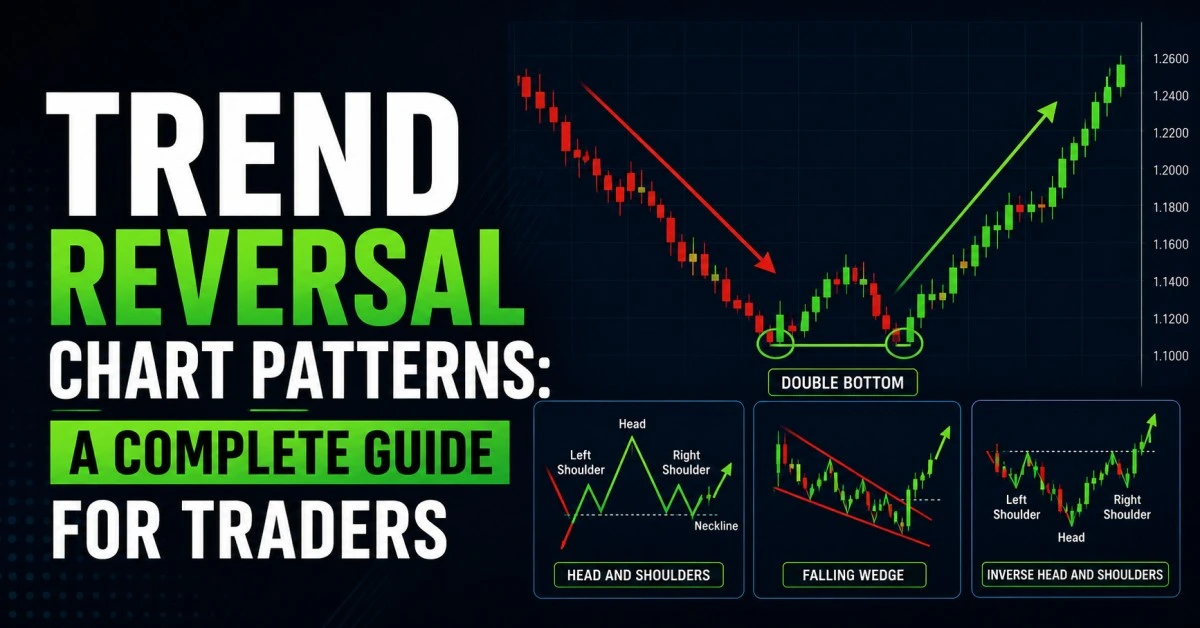
In the realm of technical analysis, chart patterns are
strong market direction predicting tools. Day traders depend on patterns such
as head & shoulders, triangles, flags, and double tops/bottoms to spot
breakouts and capitalize on them. But anyone who has been a trader for some
time knows this bitter reality all breakouts don't result in a big move.
Frequently, price breaks out of a pattern, encourages the
trader, and then reverses quickly in the opposite direction. This is referred
to as a false breakout or failed pattern. Knowing why such failures happen can
allow traders to sidestep expensive blunders and even make money off of the
traps.
What is a False
Breakout
A false breakout occurs when the price breaks past a significant
technical level — including support, resistance, or the edge of a chart pattern
— but cannot maintain momentum. Rather than carrying on in the direction of the
breakout, the price turns around, catching late entry traders.
Example
If Nifty creates a triangle pattern and breaks the
resistance, the traders anticipate a bullish action. But if the index drops
back into the triangle, it reflects a failed breakout.
Why Do Chart Pattern
Failures Occur
False breakouts are not an accident; they take place because
of market psychology and structural factors. Let us dissect the primary causes:
1. Stop Hunting by
Smart Money
Institutional players are aware of where retail traders put
their stoploss orders (just beyond chart patterns). They drive the price past
those levels to hit stops, harvest liquidity, and then drive the price back.
For instance, a stock breaking the ₹500 resistance could
prompt numerous buy orders and short stop losses. Once large players mop up
this liquidity, they drive the stock price below ₹500 again.
2. Lack of Volume
Confirmation
A genuine breakout is typically supported by heavy volume.
If the breakout is on low volume, it often suggests weak conviction. Traders
entering without reference to volume tend to get caught.
3. Market Sentiment and News Events
Occasionally, breakouts occur before major events such as
RBI policy, earnings, or international news. The initial breakout can be mere
speculation, and the reversal when real news is absorbed.
4. Overcrowded Trades
When everyone anticipates the same breakout, the move
becomes too obvious. Markets tend to do the opposite of what the crowd wants.
That is why the most hyped chart patterns fail most often.
5. Timeframe Mismatch
A breakout on a lower timeframe (such as a 5minute chart) can
fail when the higher timeframe (daily or weekly chart) will not confirm the
move. Traders who disregard the big picture tend to get trapped in whipsaws.
How to Prevent
Getting Caught in False Breakouts
Although there is no trader who can avoid failures entirely,
there are methods to minimize the risk:
Wait for a Retest
Instead of entering right after a breakout, wait for the
price to retest the broken level. When resistance becomes support (or vice
versa), the breakout is more likely to hold.
2. Verify Volume
Confirmation
Always verify if the breakout is accompanied by above average
volume. High participation enhances dependability.
3. Employ MultiTimeframe
Analysis
Prior to trading a breakout on a 15minute chart, crosscheck
the daily and weekly trend. Breakouts that also follow the trend on higher
timeframes have a better chance of success.
4. Merge Indicators
with Patterns
Employ indicators such as RSI, MACD, or Moving Averages to
verify momentum prior to entering. For instance, if RSI is in overbought
territory during a bullish breakout, the move will not hold up.
5. Manage Risk Wisely
Even with all the filters, false breakouts will occur. The
secret is to put in a tight stoploss and set position size correctly so that
one unsuccessful trade does not erase profits.
Converting False
Breakouts into Opportunities
Surprisingly, some professional traders even prefer trading failed
patterns rather than regular breakouts. Why Because false breakouts tend to
result in sharp opposite moves.
Example Strategy:
When a stock breaks
resistance but immediately retraces back in, make a short trade with stoploss
above the fake breakout high.
Such trades usually
reward with great momentum since trapped traders hurry to close out.
Real Market Example
(Indian Context)
Look at Reliance Industries creating a symmetrical triangle
around ₹2,600. Price breaks higher to ₹2,640, but volume is small. Shortly
later, it reverses back within the triangle and falls to ₹2,550.
Those who purchased
the breakout at ₹2,640 were trapped.
But those who shorted
the broken pattern made profits instantly.
This illustrates how pattern failures may be as rewarding as
successful breakouts if known well.
Conclusion
Chart patterns are great tools, but blindly falling for
every breakout is a trap. False breakouts result from liquidity hunts, poor
volume, sentiment reversals, or congested trades.
Sophisticated traders don't get caught out by simply waiting
for confirmation, employing multi timeframe analysis, and carefully managing
risk. Actually, learning to recognize failed breakouts can reveal profitable
opportunities in the marketplace.
In the game of trading, it's not being right every single
time — it's about managing risk and taking advantage of high probability
opportunities.