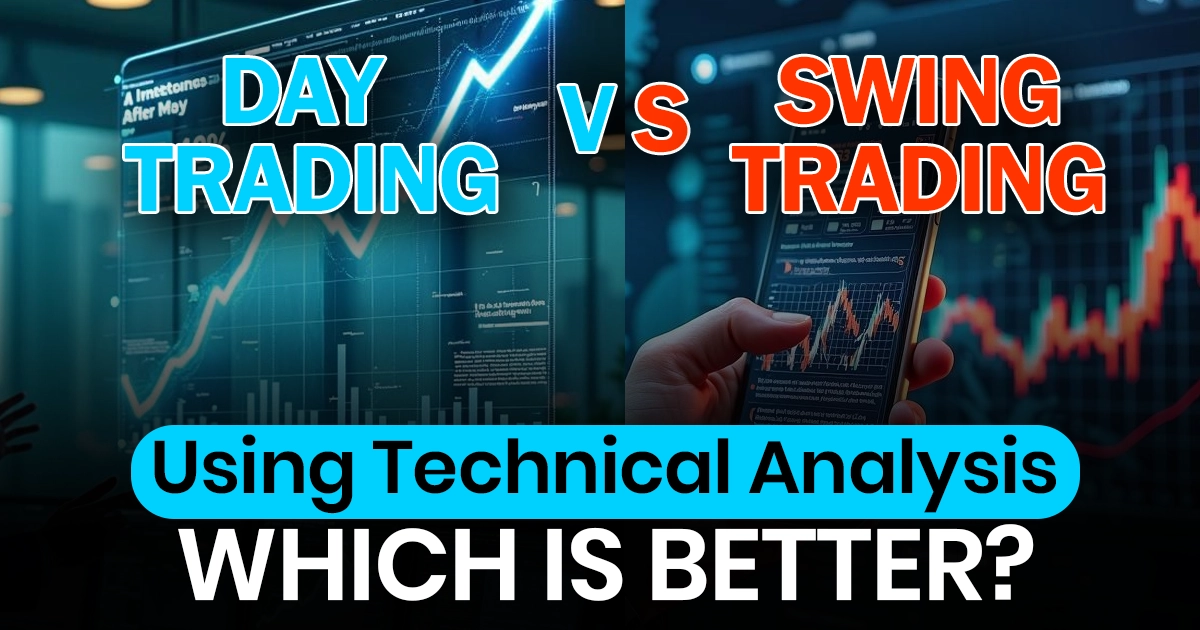
Using Day Trading vs. Swing Trading
Technical Analysis: Which One Is Best for You?
Many traders rely on technical analysis to help them make decisions in the financial markets. But how you use technical analysis depends a lot on how you trade. Day trading and swing trading are two of the most common styles.
Both use chart patterns, price movements, and technical indicators. But their methods, timeframes, levels of risk, and skill sets needed are very different. We'll look at day trading and swing trading from a technical analysis point of view in this blog so you can figure out which one is best for you.
What is day trading?
Day trading means opening and closing trades on the same day. Traders don't hold overnight, which helps them avoid risks that come up overnight, like earnings surprises, news releases, or gap openings.
How to Use Technical Analysis in Day Trading
Day traders rely a lot on short-term indicators, real-time chart patterns, and momentum analysis. Some common timeframes are: 1 minute • 5 minutes
• 15 minutes
• Charts for 30 minutes
The Most Common Indicators for Day Trading
1. VWAP (Volume Weighted Average Price) is a common way to look at intraday trends and mean reversion.
2. Moving Averages (9 EMA, 20 EMA) help you find small trends.
3. MACD on shorter timeframes—catches quick changes in momentum.
4. RSI (short length like 7 or 14) shows when something is overbought or oversold.
5. Volume Profile—helps you find areas with a lot of activity.
Benefits of Day Trading • No risk overnight • A lot of chances to trade
• Chance to catch quick price changes • Works well in markets that change quickly
The Bad Things About Day Trading • Needs to be on the screen all the time • A lot of emotional and mental stress • Higher costs of doing business • More difficult for beginners because of the noise and speed
What is swing trading?
Swing trading is all about taking advantage of price changes that happen over the course of days to weeks.
Swing traders keep their positions open overnight and depend on larger market cycles.
Using technical analysis in swing trading
Swing traders use longer timeframes, such as 4-hour • Every day (1D) • Once a week (1W)
The goal is to find big trend reversals, pullbacks, or breakouts instead of noise during the day.
The Most Common Indicators for Swing Trading
1. Moving Averages for 50 and 200 days show the direction of the long-term trend.
2. Fibonacci Retracement Levels—use them to find pullback entries.
3. MACD (standard 12, 26, 9) shows how strong a trend is.
4. RSI (14) helps you find divergence or trend exhaustion.
5. ATR (Average True Range) helps you figure out where to set your stop-loss levels.
Benefits of Swing Trading • Less time in front of the screen • More money made on each trade Better for traders who work full-time • Less stress than day trading
The bad things about swing trading • Risk of being exposed to overnight and weekend events • Less chance to trade • Needs time • Needs to have a good grasp of bigger trends
A Technical Look at Day Trading vs. Swing Trading
Comparison
1. The time frame and the accuracy of the chart Day trading uses very short timeframes, so you have to make decisions quickly. • Swing trading: uses macro timeframes, which give more reliable signals.
2. How sensitive the indicator is Day trading uses quicker indicators, like short EMAs and small RSI periods. Swing trading uses indicators that move more slowly and smoothly, like the SMA and MACD.
3. Examples of Strategies
Example of a day trading strategy: EMA crossover and VWAP pullbackS Price above VWAP means a bullish bias. 9 EMA crossing over 20 EMA means it's time to enter. • Stop-loss is tight because things are moving quickly
Fibonacci Pullback + MACD Confirmation is an example of a swing trading strategy. • Find the uptrend • Wait until the price goes back to 38.2% or 61.8% • MACD bullish crossover to confirm • A wider stop-loss based on ATR
4. Managing Risk Day traders take smaller risks with each trade, but they do it more often. Swing traders take fewer trades but risk a little more money on each one.
5. Use of volatility Day traders do well when there are short periods of volatility. Swing traders need to see a steady change in direction.
What Style Works for You?
✔ If you want to day trade, • Can spend several hours a day
• Like making decisions quickly
• Prefer to stay away from overnight risk Are okay with small wins that happen often
✔ If you want to swing trade, • Don't have a lot of time each day • Prefer trading that is more steady and planned • Can keep positions overnight Are okay with making less money at a slower pace
How Technical Analysis Works for Both Styles
1. Finding Trends
Day traders look at small trends that last for a few minutes, while swing traders look at big trends that last for days or weeks.
2. Patterns on charts Day traders look for flags, triangles, and breakouts on short timeframes. Swing traders pay attention to channels, double bottoms, and head and shoulders.
3. Support and Resistance
They both depend on these a lot, but the time frame changes: • Day traders look for highs and lows during the day • Swing traders look at levels over a week or month
4. Confirmation of Volume
Volume is still an important part of both styles for confirming technical signals.
Which style makes more money?
Many traders think that day trading is a better way to make money quickly, but it is also riskier and more complicated. Many people think that swing trading is more stable and easier for beginners.
Profitability depends on: • Managing risk
• Consistency
• Discipline
• Knowing how to read technical signals
If you have a good plan and do backtesting all the time, both styles can make you money.
In the end
Both day trading and swing trading use a lot of technical analysis, but they are different in terms of time frame, strategy, risk, and skill level. Day trading is fast and intense, and it's best for people who like to be active. Swing trading, on the other hand, is calmer and more strategic, and it's best for people who like to take their time.