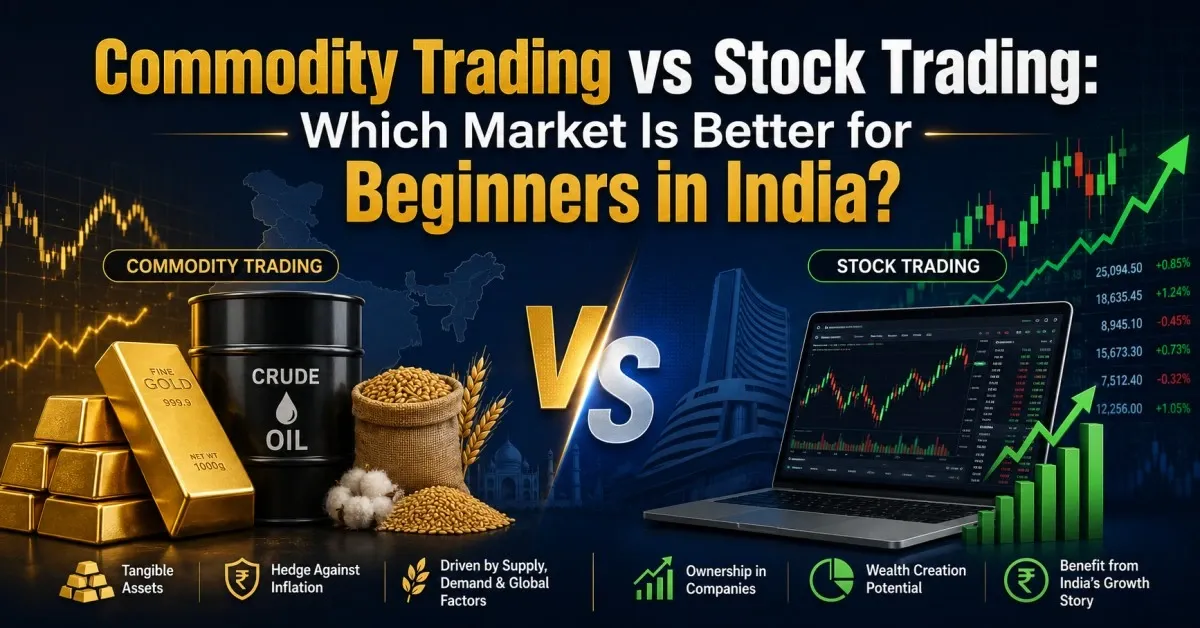
Stock Market Blogs

Order Flow trading chart with footprint chart, bid ask data, market depth and volume imbalance visualization

Order Flow Trading Explained: Advanced Strategy to Track Smart Money

Understand Order Flow trading and how traders use real-time data like bid-ask, volume, and liquidity to identify market direction and ....

Read More
Fair Value Gap trading chart showing bullish and bearish FVG zones with price retracement and smart money concept

Fair Value Gap (FVG) Explained: Smart Money Trading Strategy for High Accuracy

Understand Fair Value Gap (FVG), a powerful smart money concept used to identify price imbalances and high-probability trade setups in ....

Read More
Volume Profile chart showing POC, VAH, VAL levels with price action and volume distribution histogram

Volume Profile Explained: Advanced Trading Strategy for Smart Traders

Understand how Volume Profile works and how traders use POC, Value Area, and volume distribution to identify strong support and ....

Read More
VWAP indicator intraday trading chart showing price above and below VWAP line with volume analysis

VWAP Indicator Explained: Best Intraday Trading Strategy for Consistent Profits

Learn how the VWAP (Volume Weighted Average Price) indicator works and how to use it for intraday trading. Discover powerful ....

Read More
Open Interest Put Call Ratio (OI PCR) explained for options trading in Indian stock market

Understanding Open Interest Put Call Ratio (OI PCR) in the Indian Stock Market

Learn what Open Interest Put Call Ratio (OI PCR) is and how traders use it to analyze market sentiment in ....

Read More
ICFM stock market course chart showing stock trading learning and real market behavior analysis

How to Learn Stock Trading the Right Way: Inside ICFM Stock Market Course & Real Market Behavior Explained

Learn stock trading the right way with ICFM. Understand market behavior, build practical skills, and make smarter trading decisions step ....

Read More

Download ICFM APP

Stock Market courses App