
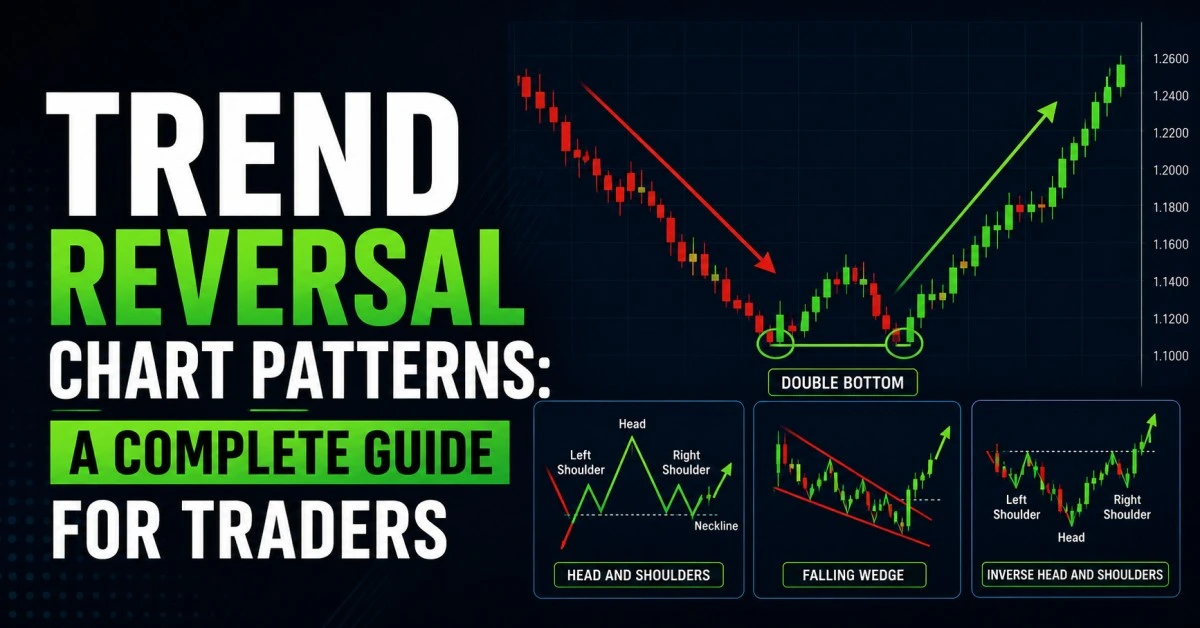
It is all about knowing the right trend at the right time and it can make all the difference in the world in your trading success. One of the most important skills for traders is to know when a trend is likely to change direction.
This is where Trend Reversal Chart Patterns come in very handy.
By watching these patterns, traders can anticipate possible changes in market direction before large moves happen. Reversal patterns can be extremely useful in making better decisions about when to enter and exit a trade, whether you are an intraday trader, a swing trader, or a long-term investor.
In this blog we will learn about the most important trend reversal chart patterns, how they work and how traders use them in real market conditions.
What are Reversal Chart Patterns?
Trend reversal chart patterns are price movements on charts that form patterns which may signal a possible change in the current trend.
E.g.
Uptrend can reverse to downtrend
A down trend can turn into an up trend
These patterns are changes in market psychology between buyers and sellers.
Reversal patterns are not guarantees of trend change, but they do increase the probability of a reversal when combined with volume, support/resistance and confirmation signals.
Why Are Reversal Patterns Important?
Trend reversal pattern helps traders:
Looking for possible market turning points
First movers in new trends
Exit losing positions ahead of big losses
Enhance risk reward ratio
Understand the psychology of buyers and sellers
Professional traders use reversal patterns along with indicators such as RSI, MACD, moving averages and volume analysis for better confirmation.
Major Trend Reversal Chart Patterns
1. Head and Shoulder Pattern
One of the most reliable bearish reversal patterns is the Head and Shoulders.
It usually happens after a strong uptrend and indicates the buyers are losing momentum.
Structure:
L Shoulder
Head
Right Shoulder
neck-line
The pattern is confirmed once price breaks below the neckline.
Why Does This Happen:
Buyers push the price higher initially
Momentum loses steam near the head
Right shoulder with less buying strength
Sellers take control after neckline breakdown
Trading Strategy :
Breakout entry after neckline
Stop loss above right shoulder.
Target is usually the distance from the head to the neckline
2. Head & Shoulders Reversal
This is the bullish side of the Head and Shoulder pattern.
It happens after a downtrend and is a sign of a possible bullish reversal.
Structure:
Bottom Left
Head (lower deep )
Bottom Right
Resistance at the neckline
The breakout above the neckline confirms the reversal.
How it works:
Again and again sellers fail to make new lows which shows weakening bearish momentum and increasing buyer strength.
3. Double Top Pattern
The Double Top is a bearish reversal pattern that forms after an uptrend.
It is like the letter “M.”
How to Form:
Price is high
Creeps away
Retests high, same
Can't break higher
support breaks
This shows heavy resistance and waning buyer momentum.
Confirmation: [name]
The pattern is confirmed after the break of the support neckline.
Trading Tip:
Often, the breakdown is accompanied by higher volume, which reinforces the bearish signal.
4. Double Bottom Pattern
The Double Bottom is a bullish reversal pattern and is the opposite of the Double Top.
It is shaped like the letter "W".
Formation:
The price makes a low
Pops back up again
Re-examining the lows
Support defended by purchasers
Resistance Flips Price
This pattern indicates a seller exhaustion and increasing buying interest.
5. Triple Top Pattern
A Triple Top is when price fails three times around the same resistance level.
It indicates:
strong opposition
Loss of bullish momentum
Potential downside reversal
The longer the resistance holds, the more important the level is.
6. Tripple Bottom
A Triple Bottom is a bullish reversal pattern that occurs after a downtrend.
It indicates:
Support zone strong
Seller fatigue;
Buyer accumulation:
Breakout above resistance confirms the bullish reversal
7.Rounding Bottom Pattern
A long term bullish reversal pattern is the Rounding Bottom.
It’s a “U” shape and signifies slow accumulation by institutional investors.
Features:
Gradual decline
Consolidating sideways
Slow rising
This pattern often occurs in fundamentally strong stocks during long-term trend changes.
8. Falling Wedge Chart Pattern
The Falling Wedge is a bullish reversal pattern most of the time.
In this form:
Price moves down within converging trendlines
Selling momentum is slowly fading
Breakout is climbing
This pattern indicates bears are losing control.
The significance of volume in reversal patterns
Volume is a key factor in validating reversal patterns.
Strong Confirmation Means:
Increasing volume on breakout
A high level of buying or selling
Powerful candle close.
Low volume breakouts are usually not reliable and can generate false signals.
Most Common Mistakes Traders Make
Pre-Confirmation Trading
Many traders get in too early before the breakout occurs.
Always wait for
Neckline breakout
Confirmation with strong candles
Volume support >
Ignoring the Big Picture
Reversal patterns work best when they form in the context of higher timeframe trends.
No Stop Loss
Even the best of patterns fail.
Risk management is a must in every trade.
Top Indicators to Use with Reversal Patterns
Divergence (RSI)
RSI Divergence can signal weakening momentum before reversals occur.
MACD cross-over
Useful to confirm changes in momentum.
Moving Averages .
Identify trend direction and dynamic support/resistance.
Support & Resistance
Patterns around major support or resistance areas tend to be stronger.
Reversal Patterns Versus Continuation Patterns
Continuation Patterns Reversal Patterns
Show change in trendSpecify the trend continuation
Make at trend extremesCreate Short pauses Form
Examples: Double Top, H & SExamples: Pennants, Banners
Used for reversal trading.For trades that follow the trend
How Reversal Patterns Are Used by Professional Traders
Experienced traders don’t only look at chart patterns.
They come together:
Structure of the market
Volume analysis
Risk management
Multi-time frame analysis
confirmation signals
The goal is not to perfectly predict every reversal, but to consistently trade high probability setups.
Conclusion
Trend reversal chart patterns are powerful tools that enable traders to spot possible changes in the direction of the market. The Head and Shoulders, Double Tops, Double Bottoms and Falling Wedge patterns tell us about market psychology and changes in momentum.
Yet no pattern is perfect.
Successful traders use chart patterns in combination with:
Correct confirmation
Volume analysis
Technical indicators
Managing risk
Mastering reversal patterns takes practice, patience and discipline. The more charts you look at the better you will get at spotting good set ups.
If you know how to identify trend reversals, you can avoid big loses in trading and benefit from strong market opportunities before the masses catch on.

Comments
Related posts
Technical analysis offers traders several indicators to understand market momentum, trend, and potential reversals. Two of the most popular indicators ....

In the world of financial markets, investors use different methods to make decisions about buying and selling assets. One of ....

Learn to recognise the difference between a trending and a sideways market with simple, practical signs on the charts before ....

Learn about the TEMA Indicator (Triple Exponential Moving Average), including its formula, advantages, strategies, settings, and how traders use it ....
In trading, one of the most persistent challenges is identifying the direction of the market and staying aligned with it. ....