Here is a quick question for you: have you ever placed a trade, followed all your indicators perfectly — RSI was oversold, MACD was showing a crossover — and yet the price still went against you?
If yes, you were probably ignoring market structure.
Market structure is the single most important concept in technical analysis. It is not a fancy indicator or a complex algorithm. It is simply the language that price speaks — and once you learn to read it, everything else on your chart starts making sense.
In this guide, we will break down exactly what market structure is, how it works in the Indian stock market, and how you can use it to trade NIFTY, BANKNIFTY, and individual stocks like Reliance and HDFC Bank with much greater confidence.
What is Market Structure?
Every financial market has a price movement organization and pattern. The price moves in waves due to the law of supply and demand; it does not move randomly.
In essence, market structure will answer the following:
Is the market in an uptrend or downtrend?
Is price consolidating, or trending strongly?
Where are the likely reversal zones?
When traders realize this, they will no longer have to guess and ascertain the market.
The Three Phases of Market Structure
Every Market, be it NIFTY, BANKNIFTY or Reliance Industries, goes through three famous phases:
1. Accumulation Phase
This happens after you've gone through a long downtrend. While retail traders are still scared, the institutions and smart money start buying up the downtrends. Prices for this period move sideways and range-bound with very low volatility.
Characteristics:
Range-bound movement.
Low volume.
False breakdowns below support.
Traders’ Approach: Try and buy before the range ends and watch for bullish movements like higher lows or breakouts from a range with higher volume.
2. Uptrend or Markup Phase
New smart money is calm, and the price action now forms higher highs and higher lows. Once this new markup price action is visible, retail participation increases and the market starts to uptrend.
Characteristics:
Increased volume on price action during the uptrend.
Dips are bought almost immediately, and down moves to support are higher with market buying.
Moving averages increase.
Traders’ Approach: Join the trend and buy when the price action retraces to the new support or near the moving averages.
3. Distribution
The delay in rally is specific to the period used in the time frame. Once the smart money takes off the market starts rallying and moves sideways, DLCH range bound near the market's highs.
Trader's Tactics: Do not open new long positions; instead hunt for breakdowns beneath support or for lower high formations indicating a possible change in trend direction.
Market Trends and Their Types
Market structure revolves around trends. Here are the three trends that control the movement of price.
1. Uptrend
An uptrend is characterized by a series of higher highs (HH) and higher lows (HL) in price movement. It indicates that the buyers- are dominating
Example
Consider the case of NIFTY which increased from 20,000 to 20,800 to 21,200 while simultaneously forming higher lows at 19,800 and 20,400. NIFTY is in a uptrend.
How to Trade
Use trendlines for price forecasting or calculate moving averages (20 EMA, 50 EMA) to determine the direction of the trend.
You buy when the price forms a higher low, and after you bought, you place a trailing stop loss below the last swing low.
2. Downtrend
A downtrend occurs when the price moves to form lower highs (LH) and lower lows (LL). This suggest that sellers are in control.
Example
The case of BANKNIFTY is a clear example of a downtrend when the price moves from 46,000 to 45,000 to 43,800 and forms lower highs at 45,800 and 44,500.
How to Trade
You sell when the price makes a rally moving toward resistance and confirm with a sell down break of support.
Place a stop loss above the last high and use it to determine if you will sell.
3. Sideways or Range-Bound Market
A sideways or range-bound market occurs when price stops moving in a particular direction and instead moves back and forth horizontally between support and resistance.
Reliance Industries moving between ₹2700–₹2800 for several sessions indicates consolidation.
How to Trade:
Buy at support and sell at resistance.
Avoid breakouts until confirmed by strong volume.
Understanding Swing Highs and Swing Lows
Swing highs and lows form the building blocks of market structure.
Swing High: A price level where the market temporarily stops rising and begins to fall.
Swing Low: A price level where the market halts its decline and begins to rise.
By connecting these points, traders visualize trend direction clearly.
For example:
Uptrend: HL → HH → HL → HH
Downtrend: LH → LL → LH → LL
When a swing structure breaks (e.g., price forms a lower low in an uptrend), it often signals a change in trend.
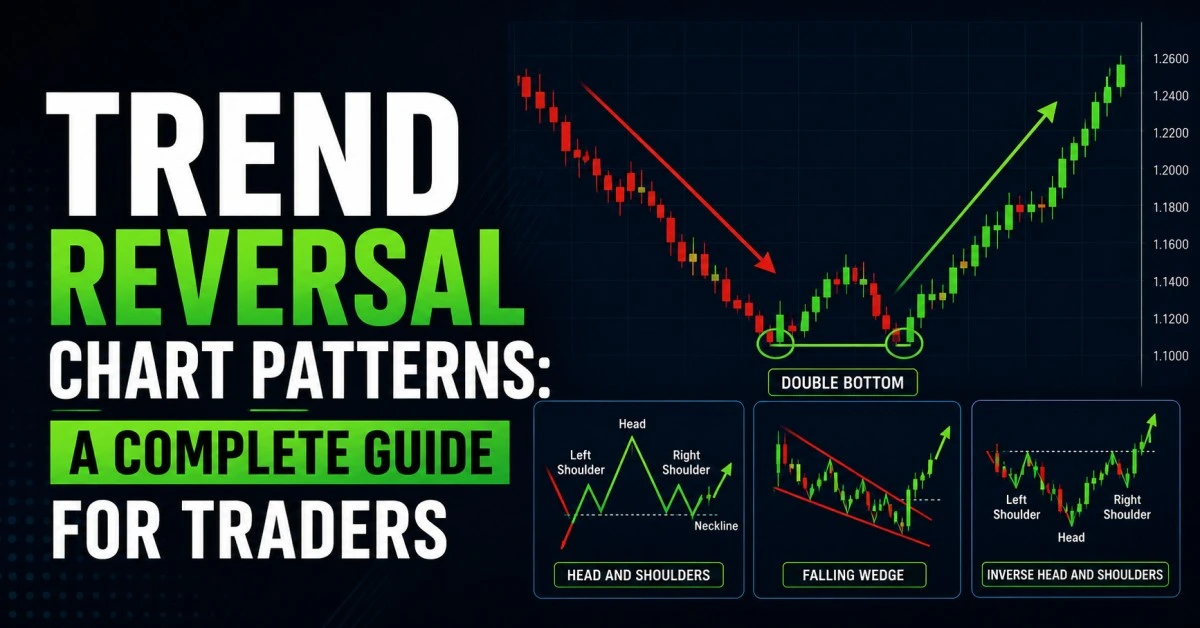
Market Structure Shift (MSS)
A Market Structure Shift happens when the existing trend reverses.
Example:
If NIFTY was forming higher highs and higher lows, but suddenly forms a lower low and fails to make a new high — that’s a structure shift.
This is an early warning of trend reversal and is often used by smart traders to catch moves early.
Significance of Multiple Timeframes
One of the biggest mistakes a beginner can make is focusing on a single chart. Professionals know the importance of multiple timeframes.
As a Daily Chart can show an uptrend while the Hourly Chart can show a pullback within that trend. The 5-Minute Chart helps fine-tune entries. This allows for the best of both worlds. Optimizing short-term precision while remaining in alignment with the broader trend.
Rule of Thumb:
Always trade in the direction of the higher timeframe structure.
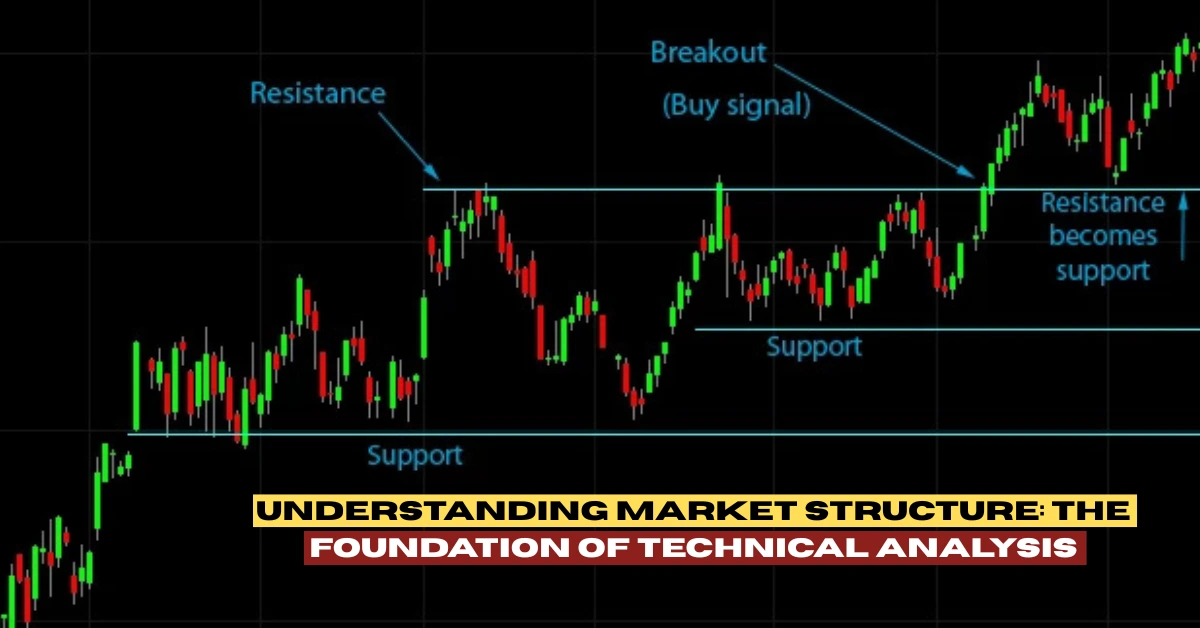
Market Structure with Support and Resistance
Market structure gives rise to support and resistance. Market structure defines when the price is likely to push higher and lower.
Every swing high becomes a potential resistance and every swing low becomes a potential support.
When price breaks these levels:
- Break above resistance: Continuation of an uptrend.
- Break below support: Downtrend continuation or reversal.
Structure helps traders visualize the key liquidity zones to potential order flow.
Market Structure with Volume
Market Volume helps determine if structure is strong or weak.
Healthy uptrends increase volume on rallies and when price pulls back the volume declines.
Weak structure may show price rise and volume decline which is a sign of reversal.
For example, if Reliance breaches its previous high with low volume, it could indicate a false breakout. But if the same event occurs with increasing volume, it shows confirmation of institutional buying.
Understanding Structure of the Market with Real Life Examples
Let us study a few examples in the Indian market to grasp how real market structure operates.
Example 1: NIFTY 50 (2023–2024)
Accumulation took place from 16,000–17,000.
Then the index moved to the markup phase to 20,000, where it registered a sequence of higher highs and higher lows.
Subsequently, distribution took place around 20,200–20,300.
Such simple observations could guide a swing trader in riding the trend while evading upside false breaks.
Example 2: HDFC Bank
HDFC Bank underwent a few months of sideways consolidation, after which it registered an upbreak of 1650 Rs with substantive volume — a classic breakout of a consolidated structure.
In this example, the subsequent pullback to 1650 Rs, which acted as a new support line, served to confirm a structure continuation.
These form over all times spans, from intraday to weekly charts.
Typical Structure Market Mistakes by Traders
- Context Ignoring: Examining the structure while disregarding the larger trend.
- Analysis Overcomplicating: Placing excessive lines or levels.
- Emotion Reacting: Instead of waiting for confirmation, trading every small swing.
- Volume Neglecting: Trading price without volume.
- Structure Not Adapting: The structure shifts. What worked in one phase might fail in another.
Keep it simple. A clearly defined piece of writing will always be more effective than ten indicators combined.
Market Structure for Trading Strategies.
We can apply the market structure in three easy steps:
Step one: Determine the Trend.
You need to figure out whether the market is in an upward, sideways, or downward trend. An upward trend is confirmed by higher highs and higher lows.
Step two: Determine the Key Swing Points.
Step three: Wait for Confirmation.
Before you take an entry, ensure that there is a shift in market structure, a change in volume, or specific candlestick patterns like engulfing and hammer at important levels. This strategy will significantly increase the probability of your trade working.
Liquidity and Market Structure
Smart money uses structure to trap liquidity. For instance, the price will move down to take out a previous low, and then reverse that upward, taking out stops and continuing the trend. This is called a liquidity sweep.
Fake breakouts of resistance are bull traps.
The most important reason these structures need to be taught are because of the consistent profitability that comes with them.
Market Structure vs. Indicators
Market structure is the indicators and the indicators are market structure. Market indicators are always based on price action data, while market structure shows the condition of the market at that exact moment.
Structure is essential because it indicates:
Initial signals of trend reversals.
Insights on the order flow.
Inherent opportunities for considerable gains and minimal losses.
Conclusion: Stop Trading Blind — Start Reading Structure
Let me leave you with one thought.
Price is never random. Not a single candle on your chart is accidental. Every bounce, every breakout, every sudden crash — it is all part of a structure that institutions and professional traders have been using for decades. They are not smarter than you. They just learned to read what was already there.
The traders who actually make consistent money in NIFTY and BANKNIFTY are not the ones with the fanciest setup or the most indicators. They are the ones sitting patiently, watching structure, and waiting for price to come to their level. That patience — built on understanding structure — is what separates a struggling trader from a profitable one.
And here is the best part. This is not a talent you are born with. It is a skill you build. Slowly at first, then suddenly everything clicks — and you start seeing the market in a completely different way. Charts that used to look like random noise start telling you a clear story.
You have already taken the first step by reading this guide.
If you want to go further — with live chart analysis, real NIFTY and BANKNIFTY setups, and mentors who actually trade — ICFM's Technical Analysis Course is where serious traders begin. We do not just teach theory. We teach you how to read the market the way professionals do, every single day.
The structure was always there. Now you know how to see it.
Frequently Asked Questions About Market Structure
What is market structure in trading?
Market structure is the pattern of highs and lows that price creates on a chart. When the market is making higher highs and higher lows, it is in an uptrend. When it makes lower highs and lower lows, it is in a downtrend. Traders use this pattern to understand the current condition of the market before taking any trade.
What is a Market Structure Shift (MSS)?
A Market Structure Shift (MSS) happens when the existing trend breaks for the first time. For example, if NIFTY was in an uptrend forming higher highs and higher lows, but suddenly makes a lower low — that is a market structure shift. It is an early warning that the trend may be reversing, and smart traders use this signal to either exit positions or look for reversal trades.
How do you identify market structure in NIFTY?
To identify market structure in NIFTY, open a Daily chart and mark the recent swing highs and swing lows. If each new high is above the previous high, and each low is above the previous low, NIFTY is in an uptrend. If highs and lows are both dropping, it is a downtrend. If the price is moving sideways between a fixed support and resistance, it is in a range or consolidation phase.
What is the difference between market structure and indicators?
Market structure is based on raw price action — it shows what the market is actually doing right now. Indicators like RSI, MACD, or Bollinger Bands are derived from price, meaning they always lag behind. Market structure gives you the real picture first. Indicators help confirm what structure is already showing.
Why do most traders ignore market structure?
Most beginner traders get attracted to indicators because they appear more scientific and precise. Market structure requires a bit of practice to read visually. But professional traders and institutions rely heavily on structure because it reflects the actual buying and selling decisions being made in the market, without any delay.