Identifying Fakeouts in Technical Analysis
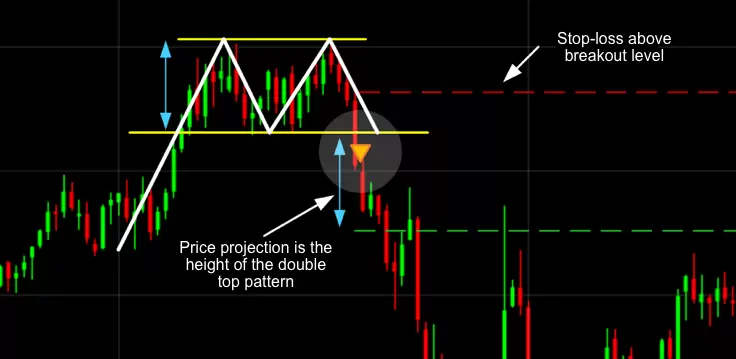
In the scope of technical analysis, a scenario when the price moves beyond the level of support or resistance only to come back to the original position is known as a fakeout. In trading, fakeouts can hinder your ability to make accurate trades. Understanding fakeouts helps keep losses in check. This is how to spot them:
1. Detecting a False Breakout
When a certain price level is breached because of a lack of guarantee, a fakeout occurs. Take, for example, when a price breaks a particular support level but comes back to where it started. The basic premise in this case is that movement through that level must be gradual, not sudden, so look for a candle that has broken the level but closed inside it.
2. Volume Analysis
Volume analysis is one of the most helpful techniques to confirm a certain fakeout situation. Breakouts which are genuine most often have volume rushing to verify it and give it importance. The same should happen with more prominent breakouts, considering there has been no volume coming with a value. Without an appreciable gain in volume, a price increase or a move to higher prices will most likely be a fakeout.
3. Confirmation of Price Action
Usually, in a real breakout, the price moves in the direction of the breakout after a brief period of consolidation. In a fakeout, there is usually a reversal of some sort, most likely a reversal pullback in the case of a breakout. Such a reversal can be identified using candlestick patterns such as a pin bar or an engulfing candle.
4. Support and Resistance Points
Significant support and resistance levels tend to witness a lot of fakes. An attempt to break through these levels only to return back to the range should be monitored closely. After a few candles, not being able to maintain the breakout level is a strong signal of a fakeout.
5. Use Indicators for Confirmation
Confirmation of price action through indicators such as RSI and MACD is also helpful. A breakout of the level – where price is breaking but indicator is not (for example RSI not leaving the ground-mid position) – also can be a fakeout.
By being on the lookout for price retracement, low volume, and confirmation by the indicators, avoiding being trapped by fakeouts becomes more plausible and improves decision-making.


