Trade Like a Pro: Mastering the Double Top and Powerful Pattern Combos
At first, the stock market may seem like a chaotic mix of candles and charts, but with time and practice, you start noticing the many underlying structures. A sure guess among beginners is the Most Reliable and a Friendly chart pattern which is the Double Top.
What if you were to combine that with other strategies to increase your accuracy? Sounds interesting, right?
That's the sole purpose of this blog - exploring the double top along with other available tools to make smarter trades with better returns.
What is a Double Top?
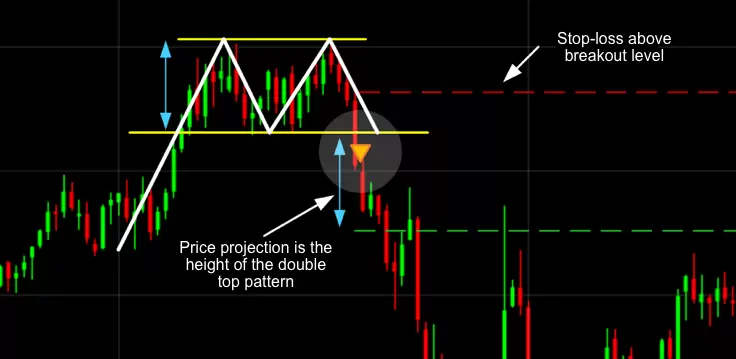
Just like any other pattern, this one also has its unique features. A double top is a bearish reversal pattern that forms precisely when there’s an increase in value. The significant difference is that it resembles the letter “M.”
These patterns are helpful in understanding Dow theory, which tells us why “there’s a stronger buy signal here.” Most of these scenarios are confirmed to be accurate due to their chance to repeat themselves.
Anatomy of the Double Top
Peak 1: Represents first increase following the uptrend.
Pullback: Price recovery for a brief period.
Peak 2: A second increase, however this piece needs further assistance reaching the aforementioned peak.
Neckline: The support level between the two peaks is referred to as the neck line.
Breakdown: A price drop below the so-called neckline supports the pattern.
Confirmation Tip: It is wise to wait until the price actually closes below the neckline. Don’t get in too soon.
Entry, Stop Loss, and Target
Entry: After the neckline breach and a candle is closed under it.
Stop Loss: Above the second peak.
Target: The distance between the peaks and neckline is measured, and that projection is placed downward.
Combining Double Top with Other Tools
A savvy trader will tell you there are other signals to capture that can be used in unison with the double top to maximize assumptive possibilities.
1. Volume Confirmation
Watching closely the volume of the second peak reveals weakness. Substantial volume during the breakdown adjudicates control to the sellers, so in this instance, the breakdown is being watched closely.
2. RSI Divergence
While the price hits double top’s equal high marks, which is relatively too volatile, the RSI forms a lower high. This is a compelling sign to make the bearish trade.
3. Supply Zone
Exhibiting a double top pattern within a strong supply zone increases the level of confirmation.
4. Timeframe Confluence
Observation of upper defined double top structures on higher time frames such as 1H or 4H provides stronger signals when compared to lower time frames.
Double Top Combo Trading Strategy
To tailor a strategy with a Double Top, RSI, and Volume, here are the key strategy components:
- Two symmetrical price peaks:
- Bearish Divergence on RSI
- Volume decrease during the second peak, and an increase during breakdown
- Breaks and closes below the neckline
Order of operations:
- Entry = breakdown
- SL = peak/neckline
- TP = range from peak to neckline
Real Example (Hypothetical)
Imagine spotting a double top configuration on the hourly chart:
Price hitting 200, retraces to 195, heads back to 200, and stalls
- 75 on the first peak, and 65 on the second results in bearish divergence on the RSI.
- Volume on the second top is lower than on the first it and price breaking below 195 with a strong bearish candle.
Double Top Mistakes to Avoid
Identifying volume and confirmation can easily destroy having a small timeframe as the primary focus.
After the uptrend is when the strategy starts to become effective.
Final thoughts
While relatively simplistic in identifying patterns, the double top does pack a punch.
Pairing it with confirmative tools such as RSI and Volume makes it incredibly accurate, while pattern + confirmation offers confidence to rely on.
Make it a habit to look out for M shapes with the expectation of zooming out in order to confirm tools and trade professionally.