Stock charts often have elegantly smooth lines that rise and fall as the price does. If you have ever tried trading, you would be familiar with that.
These are moving averages and are used by traders across the globe.
However, relying on just one moving average is not advisable.
The actual effectiveness of this tool is noticed when smart combinations of moving averages are applied.
The combination of moving averages allows traders to catch trends, filter noise and avoid useless signals which is the practice discussed in this post.
A Moving Average(MA) Explained
An index, stock or asset's price can be calculated over a set time period which in essence is a moving average.
For instance:
The 20-day moving average refers to an average closing price of the previous 20 trading days.
The same goes for a 50-day moving average, which takes into account the last 50 days.
For what purpose do we use them?
To reduce daily price fluctuations.
To identify the trend direction.
To issue buy/sell signals.
Think of it this way: price behaves like a boat on a wavy sea, and the moving average illustrates the direction of the overall tide.
Types of Moving Averages
There are many of them, but the most frequent are:
Simple Moving Average—SMA
Each price in the selected period carries the same weight.
For instance, a 10-day SMA calculates the average of the last 10 closing prices.
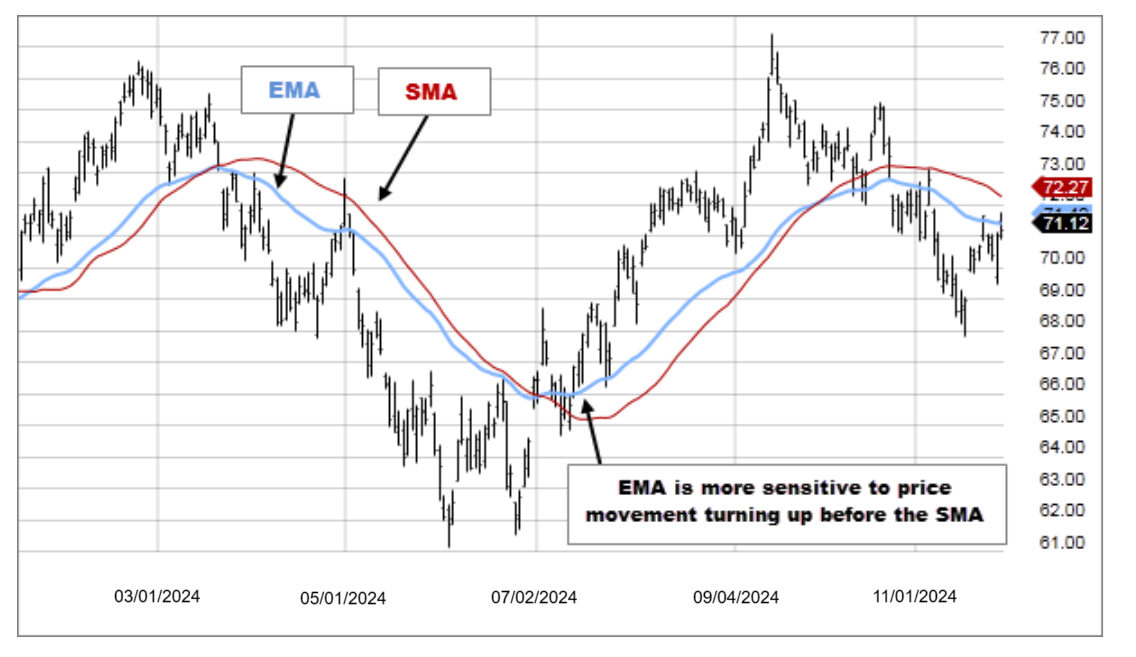
Exponential Moving Average—EMA
Dividend period weighting towards more recent prices.
Reacts faster to recent price changes than does SMA.
Example: A 20 EMA will respond faster than a 20 SMA to price increases or decreases.
Why Use Multiple Moving Averages?
Having only one moving average is problematic:
It could be either too noisy (short period) or too slow (long period).
Trending markets can also produce unreliable signals in sideways markets.
Using multiple moving averages provides:
✅ Helps eliminate fake outs
✅ Validate the intensity of a trend
✅ Enables earlier identified entry points and safer exits
Famous moving average combinations
Golden and Death Crosses (Long-term traders)
Golden Cross: When the 50-day Simple Moving Average (SMA) increases and crosses above the 200-day SMA. This is a bullish signal.
Death Cross: When the 50-day SMA decreases and crosses below the 200-day SMA. This is a bearish signal.
Why is this effective?
The big-picture trend is encapsulated by the 200-day SMA.
The medium-term trend is captured by the 50-day SMA.
Crossovers signal a change in momentum, which increases the appeal of this strategy for positional traders and long-term investors.
Fast & Slow EMA Combo (Swing traders & day traders)
Example: 9 EMA & 21 EMA
A buy signal is generated when fast EMA (9) rises above slow EMA (21).
A sell signal is generated when it trades below.
Why EMAs?
Swing traders are commonly known to operate with 9 & 21 EMAs or even 5 & 20 EMAs. Day traders use them on shorter time frames, sometimes even employing a 3 & 8 EMA on a 5-minute chart.
They provide agility as they capture swings quicker.
Triple Moving Averages (Improved Trend Filtering)
For example: 9 EMA, 21 EMA, and 50 EMA
Take trades only when:
9 EMA > 21 EMA > 50 EMA → indicates a strong uptrend
9 EMA < 21 EMA < 50 EMA → indicates a strong downtrend
This approach reduces the risk of encountering sideways movement.
In both scenarios, you act only when the market is ready.
Moving Averages: In Practice
Let’s go through it step by step:
Step 1: Opt For A Specific Trade Type
Long-term investor → prefer SMA (e.g., 50 & 200 SMA)
Swing trader → prefer EMA (e.g., 9 & 21 EMA)
Intraday trader → short EMAs (e.g., 3 & 8 EMA)
Step 2: Plot Them On Your Trading Chart
Most trading platforms (TradingView, Zerodha Kite, Upstox, etc.) let you add moving averages easily.
Step 3: Check For Crossovers & Alignment
Shorter MA above longer MA → uptrend
Shorter MA below longer MA → downtrend
Example:
If the 9 EMA is above the 21 EMA, and both are above the 50 EMA → indicates a strong bullish phase.
Step 4: Identify Dynamic Support & Resistance
Prices frequently reverse toward moving averages:
In uptrends, price may support at 21 EMA.
In downtrends, the 21 EMA may act as a rejection area for price.
This assists with:
Entry decision for pulling back retracements
Determining levels for stop-loss
Step 5: Confirm Using Volume or RSI
Moving averages are not perfect by themselves.
These confirm them.
Volume – Is the breakout valid?
RSI – Is it overbought or oversold?
Trendlines – Does it respect the broader trend?
Common Mistakes to Avoid
1. Buying or selling on each crossover signal – Results in numerous losing trades in sideways market.
2. Everyone has the same parameters on different stocks and timeframes – Different stocks will have different behaviors.
3. Ignoring the context of the market – Context matters, such market news, upcoming earnings reports, and geopolitical concerns.
4. Using too many moving averages on one chart – Too many indicators create confusion and dilute the core idea.
Real Life Examples (In Simple Terms)
Example 1: Swing Trading with 9 & 21 EMA
Apply 9 EMA & 21 EMA on daily chart.
Look for 9 EMA to cross above 21 EMA. Confirmation comes with a bullish candle.
Set your stop-loss order below the most recent swing low.
You should exit your position after 9 EMA crosses back below 21 EMA.
Example 2: Long-term Investing with Golden Cross
Follow both 50-day SMA and 200-day SMA
Build your positions once 50 SMA crosses above 200 SMA.
Stay invested until 50 SMA crosses below 200 SMA (Death Cross).
This has been effective with the Nifty 50 in the past.
Example 3: Triple EMA Trend Filter
Use 9, 21, and 50 EMAs.
Take trades only if
All are in bullish alignment: 9 > 21 > 50.
Avoid all trades where EMAs oscillate around each other meaning there is no trend.
Why Moving Averages Work Psychologically:
Every market is driven by buyers and sellers.
Essentially, moving averages reflect the average price paid by buyers recently in the market.
The shorter Moving Average reflects the more recent trader attitude.
The longer moving average reflects older trader sentiment which is typically more stable.
When sentiment shifts bullish with the shorter moving average crossing above the longer one, it typically causes a surge in buying.
How To Improve Moving Averages:
Perform a backtest on your stock or index as every asset does not respond similarly.
Modify the length: A quicker moving average will be more reactive but less reliable; a slower three will be more accurate, but timid.
Switch to logarithmic charts if you are a long-term investor.
Combine Moving Averages with price action: candlesticks, support and resistance levels.
Quick Summary Table
Style
Common Combo
Use Case
Long-term
50 SMA & 200 SMA
Trend investing
Swing
9 EMA & 21 EMA
Medium trends
Intraday
3 EMA & 8 EMA (5-min)
Quick scalps
Filter
9, 21, 50 EMA
Avoid sideways
Closing Thoughts:
Moving averages are powerful trading tools because they help traders simplify price action.
If used wisely, they help you:
Make strategic entries and exits
Control distractions
Track trends
But keep in mind that:
Moving averages only summarize previous data. They do not forecast the future.
Integrate them with risk management, volume, and price action to create a complete trading strategy.