Start
Every experienced trader knows that the price isn't the only thing that matters in the market. Traders need to learn how to read between the lines in order to really get ahead in the market. They need to look beyond candlesticks and moving averages for indicators that show how supply, demand, and sentiment work behind the scenes. Open Interest is one of the most powerful of these indicators, but it is also one of the most misunderstood.
Open Interest (OI) is a number that shows how many futures or options contracts are still open and have not been settled or closed. This is not a measure of trading volume for one session. Instead, it is a total that shows how much money is actively invested in the market at any given time. When traders really understand OI, it helps them see how the market works much more clearly.
In this blog, we'll go over everything you need to know about Open Interest, including what it is, how it's calculated, why it's important, how to read it with price and volume, and how to use it to predict market trends before they happen.
What Is Open Interest, Exactly?
At the end of a trading day, Open Interest is the total number of active (open) contracts in a futures or options market. There is a position that has been entered but not yet exited for each contract. This could happen through an offsetting trade, exercise, expiry, or delivery.
It is important to tell the difference between OI and volume. Volume counts the number of contracts that were traded during a certain time, even if the same contract changes hands several times in one day. Open Interest, on the other hand, only counts the net number of contracts that are still open. When a trader opens a new position, OI goes up. If someone who already owns something leaves, OI goes down. If two people who already own something switch places, OI stays the same.
Key Insight: Open Interest shows how many contracts are still open. When OI goes up, it means new money is coming into the market. Money is leaving when OI goes down.
How do you figure out open interest?
At the end of each trading session, OI is updated. Here is the logic in plain English:
A new buyer and a new seller sign a contract, which raises OI by 1.
A buyer who already exists sells to a seller who already exists. OI goes down by 1.
When an existing buyer sells to a new buyer, OI stays the same.
This calculation happens with options (calls and puts) and futures (equity index, commodity, and currency). For options, OI is kept track of for each strike price and expiration date.
What is the point of open interest?
Open Interest is one of the few pieces of information that directly show how many people are in the market and how sure they are. A strong, healthy trend is likely to continue if prices are going up and OI is high. Low OI and rising prices could mean that the rally is weak and not very strong, which makes it easy for it to turn around.
It is possible for Indian traders who use NSE futures and options to see OI data that is updated in real time. Understanding it can give you a big edge in terms of information, especially during times of high volatility like earnings seasons or budget announcements.
The Classic Framework for Understanding OI and Price
The most common way to understand OI is to look at it along with price movement and volume to see if a trend is likely to keep going or change direction:
1. Price going up, OI going up, and volume going up
This is the most positive of all the combinations. People are putting new money into the market, and they are doing it on the long side. Both buyers and sellers are making new trades, but buyers are in charge. This setup usually confirms an uptrend and suggests that it can keep going.
2. Price going up, open interest going down, and volume going down
This means that the rally is losing strength. The price is going up, but people are closing their positions, probably short sellers covering. When shorts cover, the price goes up automatically, but there isn't really any new buying conviction behind the move. This is something that happens a lot at the end of a bearish phase or during a bounce back.
3. Price going down, open interest going up, and volume going up
A setup that is bad for the market. People are aggressively building new short positions. Sellers are in charge and are adding to their positions. This confirms that the trend is going down and suggests that it will continue to do so.
4. Price, OI, and Volume All Going Down
This means that the current trend is coming to an end. Long holders are selling. The selling isn't coming from new shorts; it's coming from longs who are giving up. This can often happen before a base forms or a trend reverses, especially if it happens close to important support areas.
Tip: Don't read OI by itself. Always look at price action and volume together to get the full picture of what people in the market are doing.
Open Interest in Options: PCR and Max Pain
OI becomes an even more complicated tool in the options market. Two derivative ideas based on OI that traders can use are:
Put-Call Ratio (PCR)
The Put-Call Ratio is the total amount of put OI divided by the total amount of call OI. A PCR above 1 means that there are more puts than calls, which is usually seen as bearish. A PCR below 1 means there are more calls, which is usually a good sign. However, contrarian traders often see very high or low PCR values as signs that the market is about to change direction. For example, very high PCR values can mean that the worst is already priced in.
Theory of Max Pain
Max Pain is the price level at which the most option contracts (both calls and puts) would expire worthless, costing option buyers the most money. Market makers and institutional writers are thought to have a reason to keep prices close to this level until they expire. As the expiration date gets closer, traders can use Max Pain to find possible price magnets.
How to Use OI to Find Support and Resistance
One of the most useful things you can do with OI in options is find important support and resistance levels. The highest call open interest strikes act as resistance because there are a lot of calls written at that level, which means that writers are likely to defend it. Writers at the highest put OI levels will try to stop a breakdown below that level.
For instance, if the 22,000 call has the most open interest (OI) and the 21,500 put has the most OI in Nifty 50 options, the market is likely to stay in this range for a while. If the OI rises at higher strikes and the price breaks above 22,000, it would mean that people are feeling differently.
Long buildup, short covering, short buildup, and long unwinding
Advanced OI analysis breaks down the market into four main positions:
Long Buildup: Price and open interest are both going up, which means bulls are adding to their positions.
Short Covering: Prices go up and open interest goes down. This means that shorts are leaving and new bulls are not coming in.
Short Buildup: Bears are building new positions as prices go down and open interest goes up.
Long Unwinding: Price going down and open interest going down means that bulls are leaving their positions.
These differences help traders figure out if a price change is based on real conviction or is just mechanical. For instance, short covering rallies can be strong but only last a short time. A long buildup rally has a stronger structure and is more likely to last.
What traders often do wrong with OI
People often get OI wrong, even though it is powerful. Here are the most common mistakes:
Reading OI as a directional signal alone is not enough; you must always read it with price and volume.
Not paying attention to OI changes across strikes—a single number means nothing without context
Don't mix up an increase in OI with bullishness; when OI goes up and the price goes down, that's bearish.
Not taking into account how rollovers affect things—contract rolling can change OI data as the expiration date gets closer.
Useful Tools and Platforms for Keeping Track of OI
For traders in the Indian market, there are a number of platforms that offer strong OI data:
The official NSE India website has raw OI data for all F&O contracts.
Sensibull is an options analytics platform that has OI charts and PCR data.
Opstra shows OI across strikes and expiries with the Max Pain calculator.
Chartink and TradingView let you make your own screeners and OI overlays on charts.
In the end
Open Interest is more than just a number on a derivatives screen. It shows how everyone in the market thinks, what they fear, and where they are positioned. When looked at with price action and volume, OI gives you a three-dimensional view of the market that price alone can't give you.
If you trade Nifty futures, Bank Nifty options, or individual stock derivatives, using OI analysis in your decision-making will help you find high-probability setups, stay away from weak signals, and know when the smart money is coming into or leaving the market.
Markets leave marks. Open Interest makes them easier to read.
Understanding Open Interest: How to Use OI to Predict Market Trends | TradeSmart

Comments
Related posts
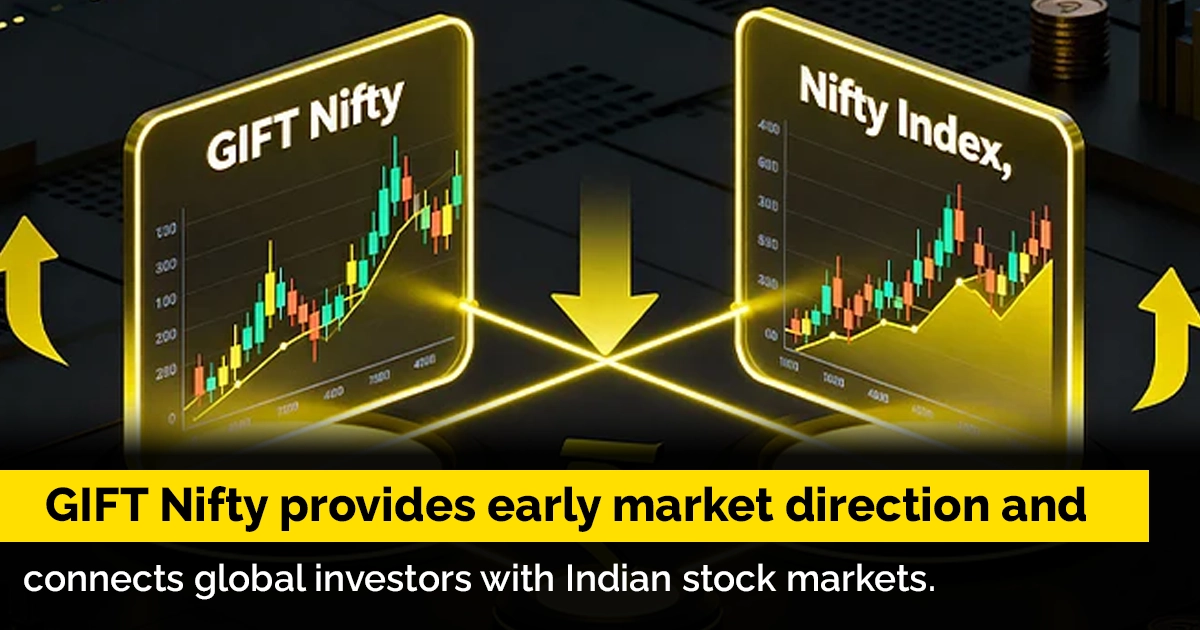
Learn how GIFT Nifty works, its trading mechanism, impact on Indian stock markets, benefits, global influence, and why traders closely ....
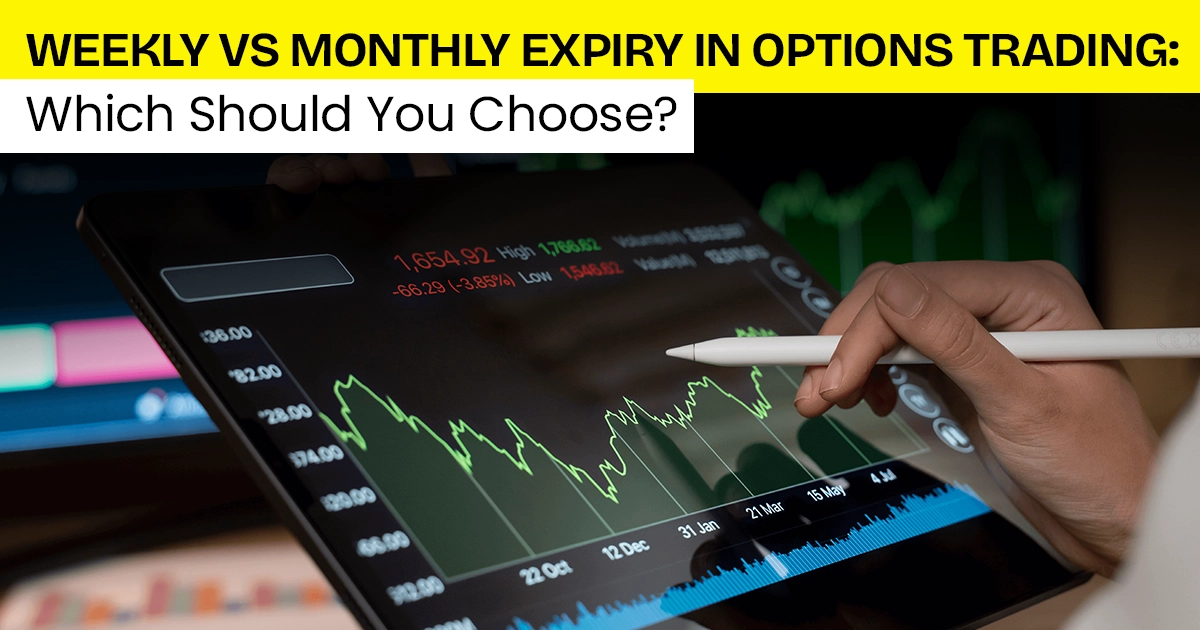
Confused between weekly and monthly options expiry? Discover the key differences in theta decay, gamma risk, premium cost, and ideal ....
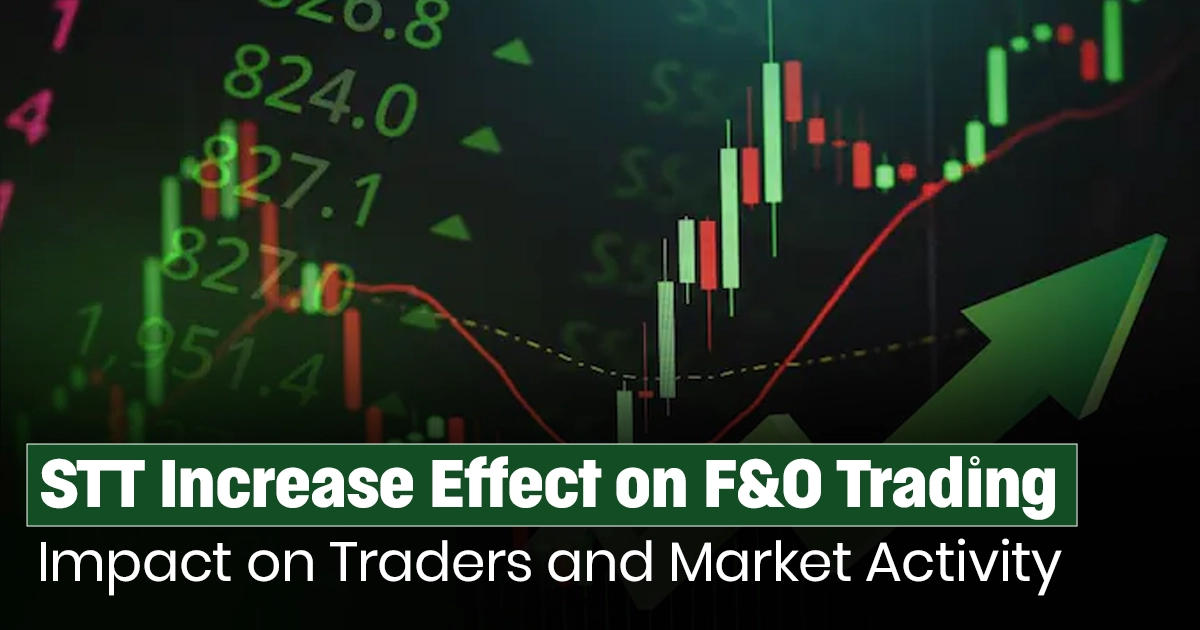
An increase in Securities Transaction Tax (STT) directly impacts F&O trading by affecting trading costs, option strategies, liquidity, and overall ....

In the Indian derivatives market, institutions (FIIs, DIIs, prop desks, hedge funds) trade options very differently from retail traders. Retail ....
The Put-Call Ratio (PCR) is one of the most widely tracked indicators in the Indian derivatives market. It is often ....
