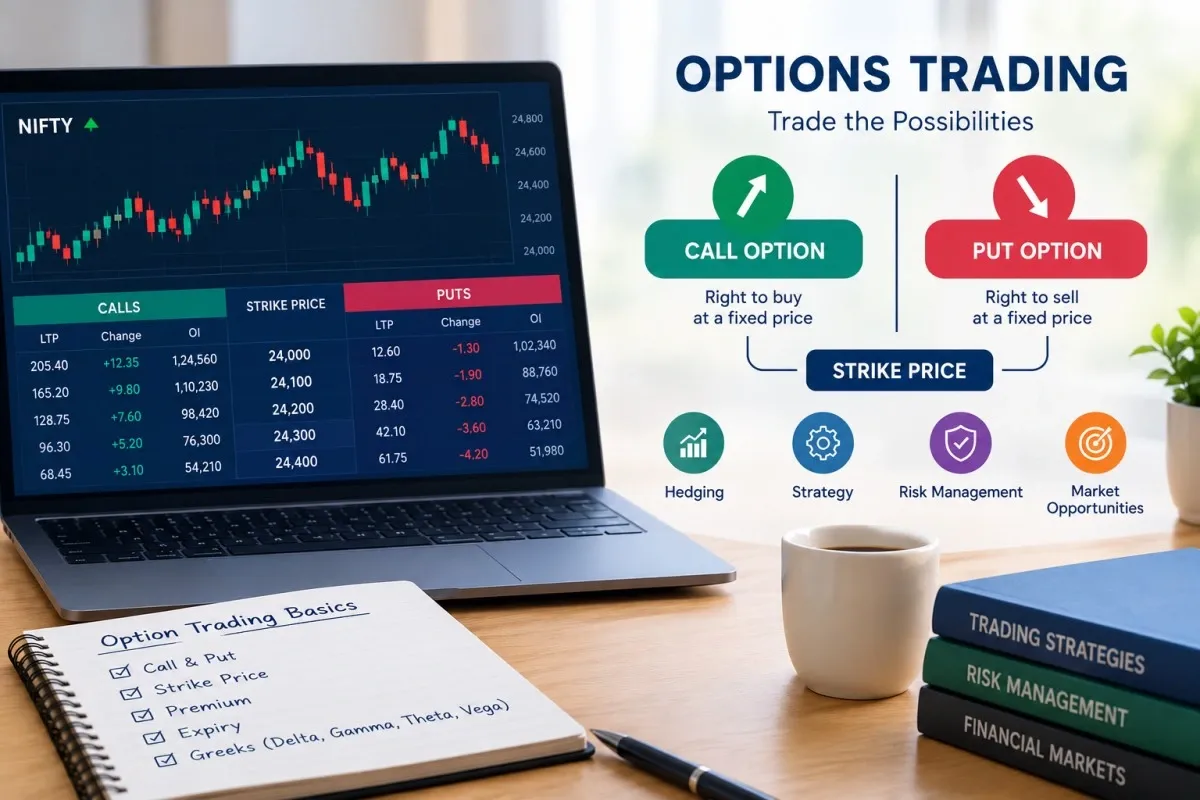
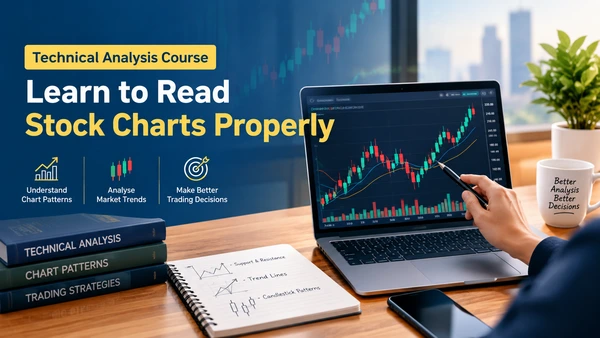
A technical analysis course teaches you how to read stock price charts, trading volume and indicators so you can understand what the market is doing and why traders react the way they do. You start with candlesticks, support and resistance, and moving averages, then move on to indicators like RSI and MACD. Along the way, you learn the part most people skip: when a signal can't be trusted.
At ICFM – Stock Market Institute, the focus is on real understanding, not on tips or promises of easy profit. No chart pattern predicts prices with certainty, and a good course will tell you that early.
How much technical analysis matters if you want to learn the stock market?
Technical analysis plays an important role in the stock market because it helps traders understand price movements, identify market trends, and study potential entry and exit points. By learning candlestick patterns, support and resistance, and technical indicators, beginners can develop analytical skills and make more informed trading decisions. At ICFM – Stock Market Institute, learning technical analysis can help students build a strong foundation in chart reading and market behaviour. However, it cannot guarantee profits and should always be combined with proper risk management and disciplined decision-making.
If you're looking for a stock market course for beginners, this is a sensible place to start. Charts are the first thing you'll see on any trading screen, so you may as well learn to read them properly.
What will you learn in a technical analysis course?
Here are the core topics, that you will learn:
- Price charts: how line, bar and candlestick charts work, and what each one shows you.
- Candlestick patterns: each candle shows the open, high, low and close for a period. Over time you start reading, buying and selling pressure in their shapes.
- Chart patterns and trend lines: spotting formations and drawing lines to see which way the market is heading.
- Support and resistance: price zones where buyers or sellers have shown up before and may show up again.
- Moving averages: averages of past prices that smooth out daily noise so the trend is easier to see.
- RSI (Relative Strength Index): a momentum indicator that hints at overbought or oversold conditions.
- MACD (Moving Average Convergence Divergence): an indicator of trend momentum and possible changes in direction.
- Price action: reading price movement directly instead of leaning only on indicators.
- Trading volume: how many shares are changing hands, which shows how much conviction sits behind a move.
- Risk management: position sizing, stop-loss planning and weighing possible loss against possible gain.
Who can learn technical analysis?
Technical Analysis can be useful for various type of learners from different type of backgrounds:
| Who you are | A sensible way to start | What you gain |
| Student | Learn basic terms, then candlesticks and simple indicators. | Market knowledge and analytical skills alongside your studies. |
| Working professional | Set a weekly routine and practise reading charts after work. | Market skills without disrupting your job. |
| Part-time worker | Study in short sessions and revise often. | Steady progress around your shifts. |
| Complete beginner | Get the basics right first, then patterns, indicators and risk. | A clear footing, without relying on tips. |
How do you learn technical analysis step by step?
If you're a complete beginner, this order works well:
Step1: Learn the market basics. Start with price movement, volume, order types and common terms. It feels slow for a week and stays useful forever.
Step2: Get comfortable with candlestick charts. Practice spotting common patterns on real charts, not just textbook pictures.
Step3: Find trends and price levels. Study support, resistance, trend lines and moving averages.
Step4: Add indicators slowly. Look at RSI and MACD next to price, and don't treat any single signal as a prediction.
Step5: Review old charts and manage risk. Test your reading on past examples, keep notes on what you got right and wrong, and learn how stop-losses and position sizing work.
Technical analysis vs fundamental analysis: what's the difference?
Technical analysis asks what the price is doing. Fundamental analysis asks what the company is worth. They answer different questions, and many learners end up using both.
| Technical analysis | Fundamental analysis | |
| Main focus | Price movements, trends and volume | Business performance, financial health and valuation |
| Common tools | Candlestick charts, trend lines, RSI, moving averages | Financial statements, earnings, cash flow, ratios |
| Purpose | Study price behaviour and possible trading opportunities | Judge a company's strength and investment value |
| Time horizon | Often short to medium term, depending on the method | Often long term, though it varies |
| Key skills | Chart reading, trend spotting, risk management | Financial analysis, business research, valuation |
Which one suits you depends on your goals, how long you plan to hold, and how much risk you're comfortable taking.
Why consider ICFM for your technical analysis course?
ICFM – Stock Market Institute offers stock market education for people who want to understand how markets actually work. Whichever institute you compare, look past the brochure. A good course makes you read a real chart, explain your reasoning, compare two indicators, and spot the situations where a signal can't be trusted. If you only listen and memorise, a live chart will catch you out.
Frequently asked questions
1. How important is technical analysis in the stock market?
Technical analysis is important because it helps traders understand price movements, identify market trends, and evaluate potential trading opportunities using charts and indicators.
2. What are the main concepts of technical analysis?
The main concepts include candlestick patterns, price charts, support and resistance, moving averages, RSI, MACD, trend lines, and trading volume.
3. Does technical analysis help in making trading decisions?
Yes, technical analysis helps traders study market behaviour and assess potential entry and exit points. However, it cannot predict every price movement or guarantee profits.
4. Why should I learn technical analysis from a stock market institute?
A stock market institute such as ICFM – Stock Market Institute can provide structured education to help learners understand chart reading, technical indicators, and market concepts.
5. Is technical analysis useful for intraday trading?
Yes, intraday traders often use technical analysis to study short-term price movements, market trends, and potential trading opportunities while managing risk.
6. Can technical analysis guarantee profits in the stock market?
No, technical analysis cannot guarantee profits. Market prices are uncertain, so traders should practise risk management and avoid relying on a single indicator or trading signal.